UA Vs GA4: How to Use the New Google Analytics 4 Data
If you own a website, there’s a nontrivial chance you’ve already heard about the impending transition from Google’s Universal Analytics (UA) service to Google Analytics 4 (GA4). If you’re still not entirely sure why Google would replace a platform that seems to be working just fine, we’ve compiled a handy guide to walk you through the upcoming shift and how to get the most out of the platform’s data!

In our article, we cover the difference between GA4 and Universal Analytics and how to get the most out of your new GA4 analytics. By understanding the GA4 platform your business can better leverage its data by analyzing the new reports and metrics available on the platform.
GA4 and Universal Analytics Overview
Both UA and GA4 provide valuable information about user interactions with apps and websites. Website owners can easily track:
- Website traffic
- Bounce rate
- Conversions
- Audience demographics
- User trends
However, there are some key differences in how GA4 and Universal Analytics track data, what data they track, and consumer privacy settings. A wave of international privacy legislation starting in 2018 with the European Union’s adoption of the General Data Protection Regulation Act was a driving factor behind many of the new privacy changes.
How Are Universal Analytics and GA4 Different?
Compared to UA, GA4 offers better smartphone app integration, greater privacy measures for website and app users, and more of an emphasis on data related to site monetization and customer retention.
Privacy on GA4
To better comply with the changing legal landscape, Google is no longer collecting the IP addresses of website visitors. Prior to this shift, UA allowed website owners to view the IP addresses of site visitors unless they chose to disable the feature. An IP address is a unique string of numbers used to identify your computer.
The introduction of GA4 has dovetailed with Google’s planned elimination of third-party cookies in 2024. Cookies are packets of information that track user behavior across the web. Cookies have been in use since the 1990s, and they play a massive role in the digital advertising landscape. The demise of third-party cookies was driven in part by legislative scrutiny on data privacy in the U.S. and Europe.
GA4 will also make it easier to delete user data, and new data retention options will put a sunset date on specific site visitor data. Finally, GA4 provides internet users with options to disable ad personalization and location-specific data.
In today’s digital world privacy laws and policies are constantly updating and your business needs to be aware of them so that your website stays compliant and you avoid any fines. This can be difficult since the laws and regulations are often different from state to state. One of the easiest ways to stay in the loop on changing laws is to use privacy software like Termageddon. This paid service keeps track of the various changing laws and provides up-to-date privacy policies that help protect your business.
Omnichannel Integration
GA4 offers new and innovative ways for users to integrate multiple websites and apps into a single, easy-to-view data stream. These streams conveniently collect and display your integrated data for enhanced decision-making activity.
By collecting this data in one location your business can easily get an overview of trends and turn GA4 data into actionable solutions.
GA4 Data and Reports
Some of the largest changes involve how Google collects data and what information it emphasizes. While UA concentrated on metrics like bounce rate, session duration, and pages visited, GA4 is hyper-focused on user engagement metrics. An “engaged session” either lasts more than 10 seconds, has a conversion event, or has two or more page or screen views.
Monetization has displaced conversions as a key metric. GA4 allows users to bundle together multiple monetization streams, including ad revenue, in-app purchases, and online sales. Unfortunately, GA4 is not equipped to handle non-monetary conversions.
UA’s session-based data has been replaced by events. Every separate action, from completing a signup form to viewing a new page, is recorded as an event, marking a major change in how data is collected and reported.
If all of these new GA4 changes seem confusing, don’t worry. You can still get the most important information that you need from the GA4 platform. Keeping an eye on this data is important to the success of your business.
With this data, you can better understand your target audience, and your website visitors’ behavior, and identify what is most important to your users. This data can be leveraged to improve your sales and marketing strategy. If you are not leveraging this data from your GA4, you are missing out on a valuable opportunity. Fortunately, you do not have to be an expert at Google Analytics 4 to understand your data and find marketing opportunities.
Get Google Analytics Analysis Reports to Your Email
One of the ways you can get the most out of your Google Analytics without becoming an expert in the platform is to use a GA4 reporting service. These reports will give you valuable data insights that you might have missed along with high-level takeaways and recommended action items. With an easy-to-understand report format you can get more from your Google Analytics data. As experts in digital marketing and Google Analytics, we offer a Google Analytics Analysis that covers the following areas.
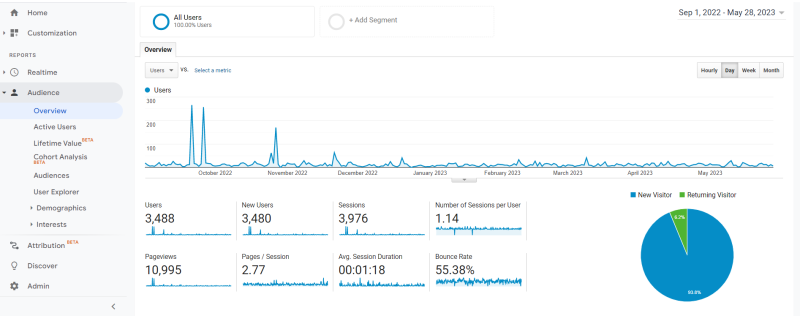
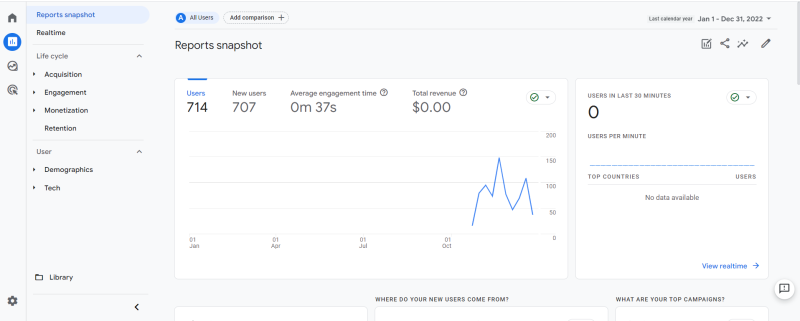
Understanding Audience in Google Analytics 4
Your audience is one of the most important things that your business needs to understand. If You can understand your audience better, you can speak directly to them. You can also measure how successful your sales and marketing efforts have been.
The Google Analytics Analysis report covers your website audience data in depth. Including:
- The volume of monthly users
- Number of sessions
- The avg time spent on each page
- Geographical data
With these metrics, you can measure how many users are visiting your website and how long they are spending on each page. This will help you determine which pages are the most valuable to your target audience, and which pages aren’t. If your target pages have consistently lower traffic levels, it may indicate that a change is needed since something about the page is not resonating with your audience. As you make adjustments you can measure the effect it has on your users.
With this data, you can easily map out user flows and identify any drop-off points that are hurting your conversion levels, and ultimately lowering your business’s ROI. Consumer trends change over time so it is important to consistently monitor your website and identify improvement opportunities. You might also see a drastic drop in user levels which could indicate something broke on the page or there is a technical issue affecting the experience.
This Google Analytics Analysis will also help you understand what regions or cities are generating the most website users. This data can be extremely helpful when planning a marketing campaign like Google Ads. By targeting your high-traffic locations your brand can squeeze out even more conversions and increase ROI. Instead of wasting money in locations where users aren’t interested in your products, target the locations that will convert. You can also easily track the increase or decrease in users from various locations on a month-to-month basis within the Google Analytics Analysis.
Finally, the analysis report will also give you insight into what type of device your target audience is using to access your website. While this may seem trivial it plays a big role in the success of your online presence. More and more users are switching to mobile devices which come with different website requirements. Websites that are not optimized risk losing these customers due to a poor website experience. If your target audience has a large share of mobile users, then your website needs to be mobile-friendly. Otherwise, you can expect higher bounce rates.
If you are not seeing increased mobile users, this could either mean that your website is not optimized for mobile traffic so there are fewer mobile users, or your target audience might not favor mobile devices. This is more common for B2B industries, but it is still best practice to make sure that your website can support mobile devices. Your website should cater to all devices and the most common screen sizes. With the analysis report, you can easily view the device and screen sizes of your website users.
Understanding Acquisition in Google Analytics 4
One of the most important questions that most business owners have is how are their customers reaching their website? Are they searching for the product or service that you provide and clicking your website results? Perhaps they see a sponsored ad and click it. Or they may have just clicked on an email blast that you sent to your mailing list of potential customers. Each of these examples presents a very different means of acquisition and it is important for your business to identify each of the ways that your customers find you.
When it comes to acquisition, how your customers find your website, Google Analytics tracks it under the following channels:
- Organic
- Direct
- Referral
- Paid (CPC)
When a user lands on your website, Google will record it as one of the above options.

Measure Organic Traffic
Organic means just that, users who found your website organically. Through a Google search your website page was triggered and a user clicked on it. This traffic acquisition channel is one of the most important since it typically generates new website users. Ideally, this should be the leading source of new website visitors. By analyzing your Google Analytics Analysis report you can determine whether you have a good level of organic traffic
If your website does not have high levels or organic traffic then it is important that you consider marketing strategies to increase organic traffic. One of the best ways to increase organic website visitors is through an SEO strategy.
SEO (search engine optimization) creates search engine-optimized content that will rank higher in the search results and give your business more visibility. By focusing on keywords and phrases that your target audience uses in their search queries you can create content that the search engine crawlers will deem relevant, and as a result, they will rank it higher than other content.
Unfortunately, SEO doesn’t happen overnight and it takes a well thought out and comprehensive SEO marketing plan to achieve the desired results. But with the right strategy, your efforts will be rewarded over time with a wider audience reach.
Related Resource: Ultimate SEO Guide for Your Business
Measure Direct Traffic in GA4
The other common source of website traffic is direct traffic. This is the type of website traffic that finds your website by entering the URL into the search bar. These users are already familiar with your brand and have likely visited your website before.
This is a good measure of how many familiar users are finding your website each month. As you spread awareness through capturing more organic traffic this number should continue to grow month over month on your analysis report.
However, it is important to note that with new user privacy options, Google Analytics 4 is mis-categorizing some users as direct traffic. This occurs because they have certain browser privacy settings enabled and Google cannot identify where the user came from before landing on your website, so they erroneously end up being classified as direct traffic.
What is Referral Traffic?
Referral traffic is website traffic that does not come from direct URL searches or search engines but instead comes from a direct link. This could be a hyperlink on another website like Facebook, or an online directory. Referral traffic could also come from your other business websites if you have them.
Email marketing can also increase your referral traffic numbers. Be sure to include UTM codes in order to identify which referral traffic came from your email campaigns. Sometimes social media traffic is counted under referral traffic as well.
Analyzing Paid Traffic in Google Analytics
One of the other traffic sources that you can see in your Google Analytics Analysis reports is paid traffic. You will only see this traffic if you have a paid ad campaign running like Google Ads. This metric gives your business insight into how many visitors are coming to your website from ad clicks.
For many businesses, Google Ads traffic is an important source of traffic and drives the majority of conversions on the website. Google Ads can be one of the best strategies to capture new sales or leads for a minimum spend. By reviewing your analytics analysis you can easily measure how much impact your Google Ads campaigns are having on your website traffic. If you aren’t seeing great results from your ads, then it may be time to consider using Google Ads experts to manage your ad campaigns.
Understanding Behavior in Google Analytics 4
This section of the Google Analytics Analysis report helps you understand the actions that your website users take once they land on your website. Analyzing this information will help you get a better idea of your user flows, and identify the pages that matter most to your audiences.
Not only does our in-depth report show how many users were on your pages, but it also shows how long they spent on each page. With this metric, you can see which pages engaged your users the most and which pages were the least engaging.
Another feature of the analytics report is the ability to see your website’s search log. Your search log reveals the terms or phrases that your website visitors are searching for when on your website. These metrics give you insight into the topics that interest your user base. Use these phrases and terms in your marketing efforts. You can answer questions and create content based on your user’s interests and questions.
While this information is not readily available in Google Analytics 4, the Google Analytics Analysis report makes it easy to review the data. You can browse every single search query and the landing page that was triggered using the interactive report features. This information can help you stay ahead of trends and create content with real value for your target audience.
Understanding Performance Data for Your Website
How your website performs plays a big role in its overall rankings and the user experience. A slow website will cause users to bounce and a broken website will hurt your brand image. By keeping track of your website performance data you can ensure that your website is doing what it’s intended to do.
With the Google Analytics Analysis reports you can quickly view your website’s performance metrics for mobile and desktop users. The report includes scores for:
- Performance
- Accessibility
- Best Practices
- SEO
Each of these plays an important role in the overall health and function of your website. If there are issues affecting your scores the data will reflect where your website needs work. You can then decide how you plan to tackle the issues, whether you need a website improvement plan or website support for quick fixes. Either way, it is better to know the issues your website faces so you can create a plan to address them.
With your Google Analytics Analysis, you can easily see all the important data and metrics for each section of the report. The report helps break down the main categories for your user metrics in a way that makes it easy for your business to understand and provides insights on each section written by our digital marketing experts. Insights can help your brand make better sense of the data and provide recommendations based on the information we discover.
How to Leverage Google Analytics Data for Your SEO Marketing Plan
With all the new data measuring and capture tools in GA4, there is a significant opportunity to leverage this data into your SEO and content marketing strategy. By using this data to your advantage, you can better engage with your target audience.
Diving into your Google Analytics 4 data you can check out what pages are engaging your customers most. For example, if you had a page that discussed manufacturing marketing services and it was receiving high levels of traffic, then it would be a good idea for you to expand on that topic.
You could create blogs or articles that discuss how to create a manufacturing marketing plan, share tips and advice, or create any other related content that would be valuable to this subject. Then once these content pieces are live you can measure the impact they have on user behavior through sessions and avg time on the page.

If you have high-performing pieces of content, you can link to other related content to help drive traffic from the popular pages to lower-performing pages. This will help gain user interactions on the content you link to and help build your internal linking strategy which is good for technical SEO.
While SEO strategies take time to yield results, they are well worth the investment in the long run and will provide increasing ROI over time. If you have no idea how to implement an SEO strategy, you can always rely on experts to create an SEO strategy for you. OR check out some of our free SEO and marketing resources.
If you are already doing SEO, but not seeing the results you want then you should take our 5-minute completely free marketing ROI assessment. It is completely free, not even an email is required! Just open our marketing assessment and answer the quick question to get your results.
Important Dates For UA and GA4
If you’re worried about the upcoming changes to Google Analytics, you still have until July 2023 to prepare for them. Universal Analytics will be officially discontinued on July 1, 2023. Users of 360 Universal Analytics services will retain platform access until July 1, 2024.
Keep in mind, this is the latest date you’ll be able to access UA. GA4 has already been released to the public. It’s recommended that UA users make the switch as soon as they’re able to get a head start on data collection for GA4’s automated insights. If you don’t want to give up your UA interface just yet, Google makes it easy to set up a parallel GA4 property alongside your UA property with its GA4 setup assistant wizard.
Otherwise, you can always rely on Google experts to handle the transition for you as part of a support pack or website improvement plan.
What Happens to My Existing Data in Universal Analytics?
Migrating site data to GA4 is a top concern for UA users. Unfortunately, due to core differences in what data is collected and the way data is measured, no automatic site data migration options exist. Google offers a lengthy explanation of the fundamental differences that make data migration untenable on one of its support pages.
Fortunately, you won’t have to give up your old data. Google allows users to manually export their data from UA. Users will be able to export their UA site data for an extra six months after the July 1, 2023, UA expiration date.
While the new Google Analytics 4 will come with challenges and a learning curve, in the end, it should help provide better insights into your website data. With support tools and analysis options available your business can easily make the most out of your GA data.